 by Alex Scheeline
The Smithsonian Institution’s National Museum of American History, on the national mall in Washington, D.C., has an especially fascinating exhibit on Thomas Edison. The exhibit highlights the development of electricity and lighting, and, more generally, invention. In late 2017, I visited an area that featured a set of lamps—including a low-pressure sodium vapor lamp, a mercury lamp, an incandescent lamp, and a compact fluorescent lamp.
Here is a close-up of part of the exhibit:

As shown by the captions under each lamp in the picture, the emphasis of the exhibit is on energy efficiency. The low-pressure sodium vapor lamp puts out the same amount of light as the mercury vapor lamp or incandescent lamp. However, the light is at lower power. Usually, the first thing a spectroscopist notices is that the perceived color of each lamp is different. My instinct was to look at the exhibit through a diffraction grating. And, thanks to having a SpectroBurst™ Viewer at hand, I had one!
In fact, I had two viewers available. But I chose the 500 line per millimeter linear grating (blue frame in the Viewer set). Even though I’ve located incandescent lamps, fluorescents, and high-pressure sodium vapor lamps around our neighborhood in Champaign, I had yet to find a low-pressure sodium vapor lamp to observe for comparison with its high-pressure cousin.
Here was my chance! Low-pressure sodium vapor lamps emit the sodium doublet at 588.9 nm and 589.5 nm rather than a broad continuum as comes from high pressure sodium vapor lamps.
What do the spectra look like?
First, here’s a picture of your intrepid blogger. I’m taking a picture without a grating.

Now here’s the unannotated picture of the exhibit through the grating. Below, I’ll mark it up and describe what is seen.

This looks messy, because there are many spectra generated from the three different lamps. There are multiple images of the sodium vapor lamp. The mercury lamp puts out spectra to left and right (since the camera was mostly centered on the mercury lamp). From the right, there are continua from the incandescent lamp. Around the edges are spectra whose source and identity aren’t immediately obvious.
So I marked off all the lines I could identify. Here they are:

The yellow lines relate to the low-pressure sodium vapor lamp. The light blue bands identify light from the incandescent lamp. The green lines relate to the mercury lamp. There are additional continua from the incandescent lamp to the right of the field of view.
Let’s dissect these spectra.
Low-pressure sodium vapor lamp (identified with yellow lines)
At the left, middle, is zero-order for the sodium vapor lamp. Because the lamp is large, the 588.9 nm/589.5 nm doublet cannot be resolved. From the center of the zero order image to the center of the first order image is about 3/8 of the picture width. The second order is another 3/8 of the way across. As one would expect, the space between orders is about the same. But where is third order? It’s off to the right of the field of view.
Near the bottom of the picture, there’s a reflection of the light from the lamp. And sure enough, first and (weakly) second order show up as the grating disperses light from the reflection as well as from the original lamp.
The diffraction orders are tilted to make for easier annotation. (I was thinking ahead.) Probably if I had rotated the grating about 5° clockwise, the orders would have been dispersed parallel to the horizontal edges of the photo. But then distinguishing some orders from each other would have been more difficult.
Incandescent lamp (identified with blue lines)
Zero order shows a highly saturated image of the incandescent lamp. First order (with the visible range marked in the image) comes not only from the filament but also from glints off the glass envelope of the bulb. There is a weak second order spectrum farther to the left but I left it unmarked because the mercury arc lamp and sodium vapor lamp give more prominent features in this region. But can you see the continuous spectrum there?
Mercury arc lamp (identified with green lines)
Analyzing these lines is pretty simple at first. However, soon there’s a head-scratcher. But once we evaluate the clues, the problem solves itself in a flash!
Look up the neutral mercury spectrum with your favorite search engine. You’re surely discover that the brightest mercury lines are:
| WAVELENGTH (NM) | COLOR |
|---|---|
| 404 nm | Violet |
| 435 nm | Blue |
| 546 nm | Green |
| 579 nm | Yellow |
And sure enough, all four of these lines are easily visible from the mercury arc. But there’s a light blue line about half-way between the 435 nm line and the 546 nm line. Plus, there’s also some red light there. What’s going on?
It isn’t mercury emission. I looked at the NIST wavelength charts. A lot of mercury lamps have an inert gas fill to help the lamp ignite; argon is common, helium, neon, krypton, and xenon less so because they are more expensive. The argon ion laser emits light at 488 nm. I almost got suckered by that fact! However, I continued thinking:
| LINE | POSITION (PIXELS) |
|---|---|
| 435 nm | 728 |
| Blue unknown | 754 |
| 546 nm | 778 |
So let’s do linear interpolation.
(754-728)/(778-728) = 0.52
0.52*(546-435) = 58 nm
435 nm + 58 nm = 493 nm
We assume that dispersion is constant everywhere (a poor assumption, even in the best of spectrometers), so if we’re off by a few nanometers, that’s plausible. What common gas emits near 490 nm? And then it hit me. Bohr atom! Hydrogen atomic emission! Blue-green line (H beta) is at 486 nm, and the red (H alpha) line is at 656 nm! 656 nm is red, and lo and behold, there’s red light in this spectrum! While I can’t prove it without a better calibrated instrument and better resolution, it sure is a simple answer to say there’s hydrogen in this mercury lamp.
And that, ladies and gentlemen, is how one uses atomic emission spectroscopy for qualitative analysis.

So now we can label each line. To keep the image clean, use this concordance to link each labeled feature to its corresponding meaning.
| LINE | LABEL |
|---|---|
| A | Sodium vapor lamp, zero order |
| B | Sodium vapor lamp, 589 nm, first order |
| C | Sodium vapor lamp, 589 nm, second order |
| D | Reflection of sodium vapor lamp, zero order |
| E | 589 nm first order image of reflection of sodium vapor lamp |
| F | 589 nm second order image of reflection of sodium vapor lamp |
| G | Zero order, incandescent lamp |
| H | Blue end of first order, incandescent lamp |
| I | Red end of first order, incandescent lamp |
| J | Zero order, mercury lamp |
| K | First order 404 nm mercury |
| L | First order 435 nm mercury |
| M | First order 486 nm hydrogen |
| N | First order 546 nm mercury |
| P | First order 656 nm hydrogen |
| Q | Second order 404 nm mercury |
| R | Second order 435 nm mercury |
| S | -1 order 404 nm mercury |
| T | -1 order 435 nm mercury |
| U | -1 order 486 nm hydrogen |
| V | -1 order 546 nm mercury |
| W | -1 order 579 nm mercury |
| X | -1 order 656 nm hydrogen |
| Y | Zero order, reflection of mercury lamp |
| Z | First order 404 nm mercury from reflection of lamp |
| a | First order 435 nm mercury from reflection of lamp |
| b | -1 order 404 nm mercury from reflection of lamp |
| c | -1 order 435 nm mercury from reflection of lamp |
| d | -1 order 486 nm hydrogen from reflection of lamp |
| e | -1 order 546 nm mercury from reflection of lamp |
| f | -1 order 579 nm mercury from reflection of lamp |
Once again, serendipity has reared its head (see my TEDxUIUC talk). I went to the museum to get some material for my blog, but what you’ve read here wasn’t what I was looking for. When I was a postdoctoral fellow in 1978-1979, I visited the same museum, and at that time there was an exhibit with Henry Rowland’s original grating ruling engine – complete with a foot switch to step on. By stepping on the switch, a visitor could rule the next groove on a piece of speculum metal. I figured description of early grating ruling engines, grating replication and how holographic gratings are now replacing ruled, replica gratings in many cases would make an interesting blog post. But look what happened instead!
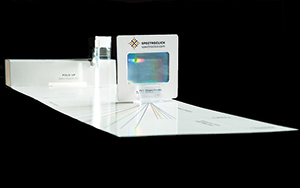 The 500 line per mm grating I used here is the same material as the grating in Educational Innovations‘ SpectroClick Kits. While the SpectroClick Kit grating is smaller than the one in the SpectroBurst™ Viewer, both can be used to look at spectra from all sorts of light sources (except those that are too bright to be safe – the sun or a laser). A Teacher Kit is available, as well as a Basic Kit for the classroom.
What is discussed in this blog post is qualitative – it identifies what is present, but not how much. Sure, there are equations and numbers, but to an analytical chemist, that doesn’t make it quantitative. Quantitative analysis measures how much of a material is present; for instance, how much hydrogen is in that mercury lamp? The SpectroClick Kit, when used with a digital camera and our free software, can do quantitative measurements of spectra from different sources. The Kit allows you to jump inside an instrument and perform your own experiments!
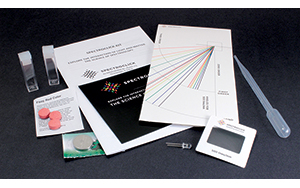
SpectroClick Teacher Kit (individual set)
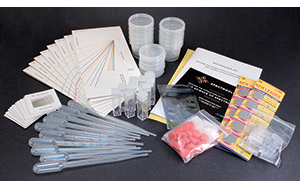
SpectroClick Basic Kit (classroom set of 10)
reproduced with permission from Spectroclick.com
Copyright (c) SpectroClick Inc. 2018


Thanks Jill.