 by: Ron Perkins
Whether teaching general science, chemistry or physics, one of the first experiments I assigned was to determine the density of a metal using a set of different sized cylinders of aluminum in a tray.
Each Student:
- Determined both the mass and volume of a single assigned sample.
- Recorded their data point on a large classroom Mass vs. Volume Graph.
- Participated in a class discussion on: determining volume by different methods; drawing a straight line through the data points (including the origin); and calculating the slope of the line (rise over run)
Ron’s suggestions:
1. 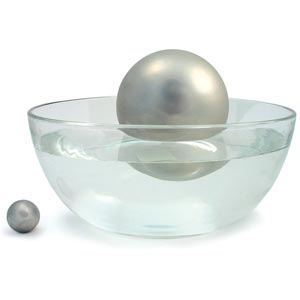 The Density Sphere Experiment Kit (DEN-10) or Steel Sphere Density Kit (DEN-350) are ideal beginning sets. The Density Paradox (DEN-300) is interesting as the solid object sinks and then floats in one beaker of water, but when put into a second beaker of water, it floats at first and then sinks. The Poly Density Kit (DEN-460) is interesting because the specimens float.
2. The Density Mystery Set (DEN-202) uses the element of surprise to teach students to trust their data. The set is made of two different polymers, each with its own density. When the data is plotted, two different straight lines are produced, each with its own slope or density. Typically students will assume that the material is all the same and start questioning their own measurements. About half of the samples sink in salt water and half float.
 3. Our most popular set, the Density ID Set (DEN-212), provides samples of 12 different substances. Also popular are the cubes of Six Metals (DEN-220). Once students have mastered mass and volume measurements, they find it interesting to be able to identify a substance by determining its density.
Advantages of using our Density Kits:
- Students learn that the density depends upon the ratio of mass to volume and not upon size of the sample.
- Students observe that some methods for determining volume are more accurate than others.
- Students discover that the slope of the “best” straight line usually gives a more accurate density value than calculating from a single piece of data.
- The teacher can immediately tell from the data points if a student needs help in measuring.
- The teacher can quickly see if all of the samples have been returned at the end of class.
Hello,
I have a set of DEN-200 (plastic density rod set). The black rods have a density of 1.41g/cm3 and the red rods 1.14g/cm3. While placed in regular tap water, distilled water, hot/cold water, the same result: red float, black sink. Now, with a density of 1.14 greater than that of water, what rationale/explanation would you recommend for a middle school student?
Do you a have good list of densities of common materials? I mostly check this list, http://www.densitiestable.com/solids. Do you know a better list?
Hans